Update: The extension has now been published and is available here →. I recommend continuing to read if you're interested in how React Server components work.
I've been interested in the potential of React Server Components (often referred to as RSC) ever since the concept was first presented → in December of 2020.
There's much you can speak to about benefits and drawbacks, but the core capability that interests me is the ability for the server stream content as it loads and renders on the server.
Now, developers can define areas in their sites where content may take longer to load. While its loading, a fallback can be shown. These areas are called <Suspense> boundaries. They allow you to unblock the rest of the page while they're still loading. And the loading part can now happen server-side. Previously, everything we've rendered on the server was blocking the initial page load. But now, the server can stream rendered content to client as it becomes ready.
Recently, this is all starting to come together and be useable in production. In this article we'll first explore the how React Server Components are represented over the network and then how I'm using this to create devtools.
The lack of devtools for RSC
Unsurprisingly, there isn't much tooling for React Server Components yet. Everyone is working hard on creating frameworks, creating libraries with new capabilities, and thinking about wether or how they could use RSC in their sites and apps.
The good thing though is that there is quite a bit of data to work with. Arguably much more than we've ever had before.
There's this format that RSC uses when streaming content to a page. It's been referred to as the "wire format" sometimes. It's changed since 2020, and will likely change again, but this is an internal spec managed by React, so you don't need to care about it while developing apps. However, I've found the data inside of it quite interesting.
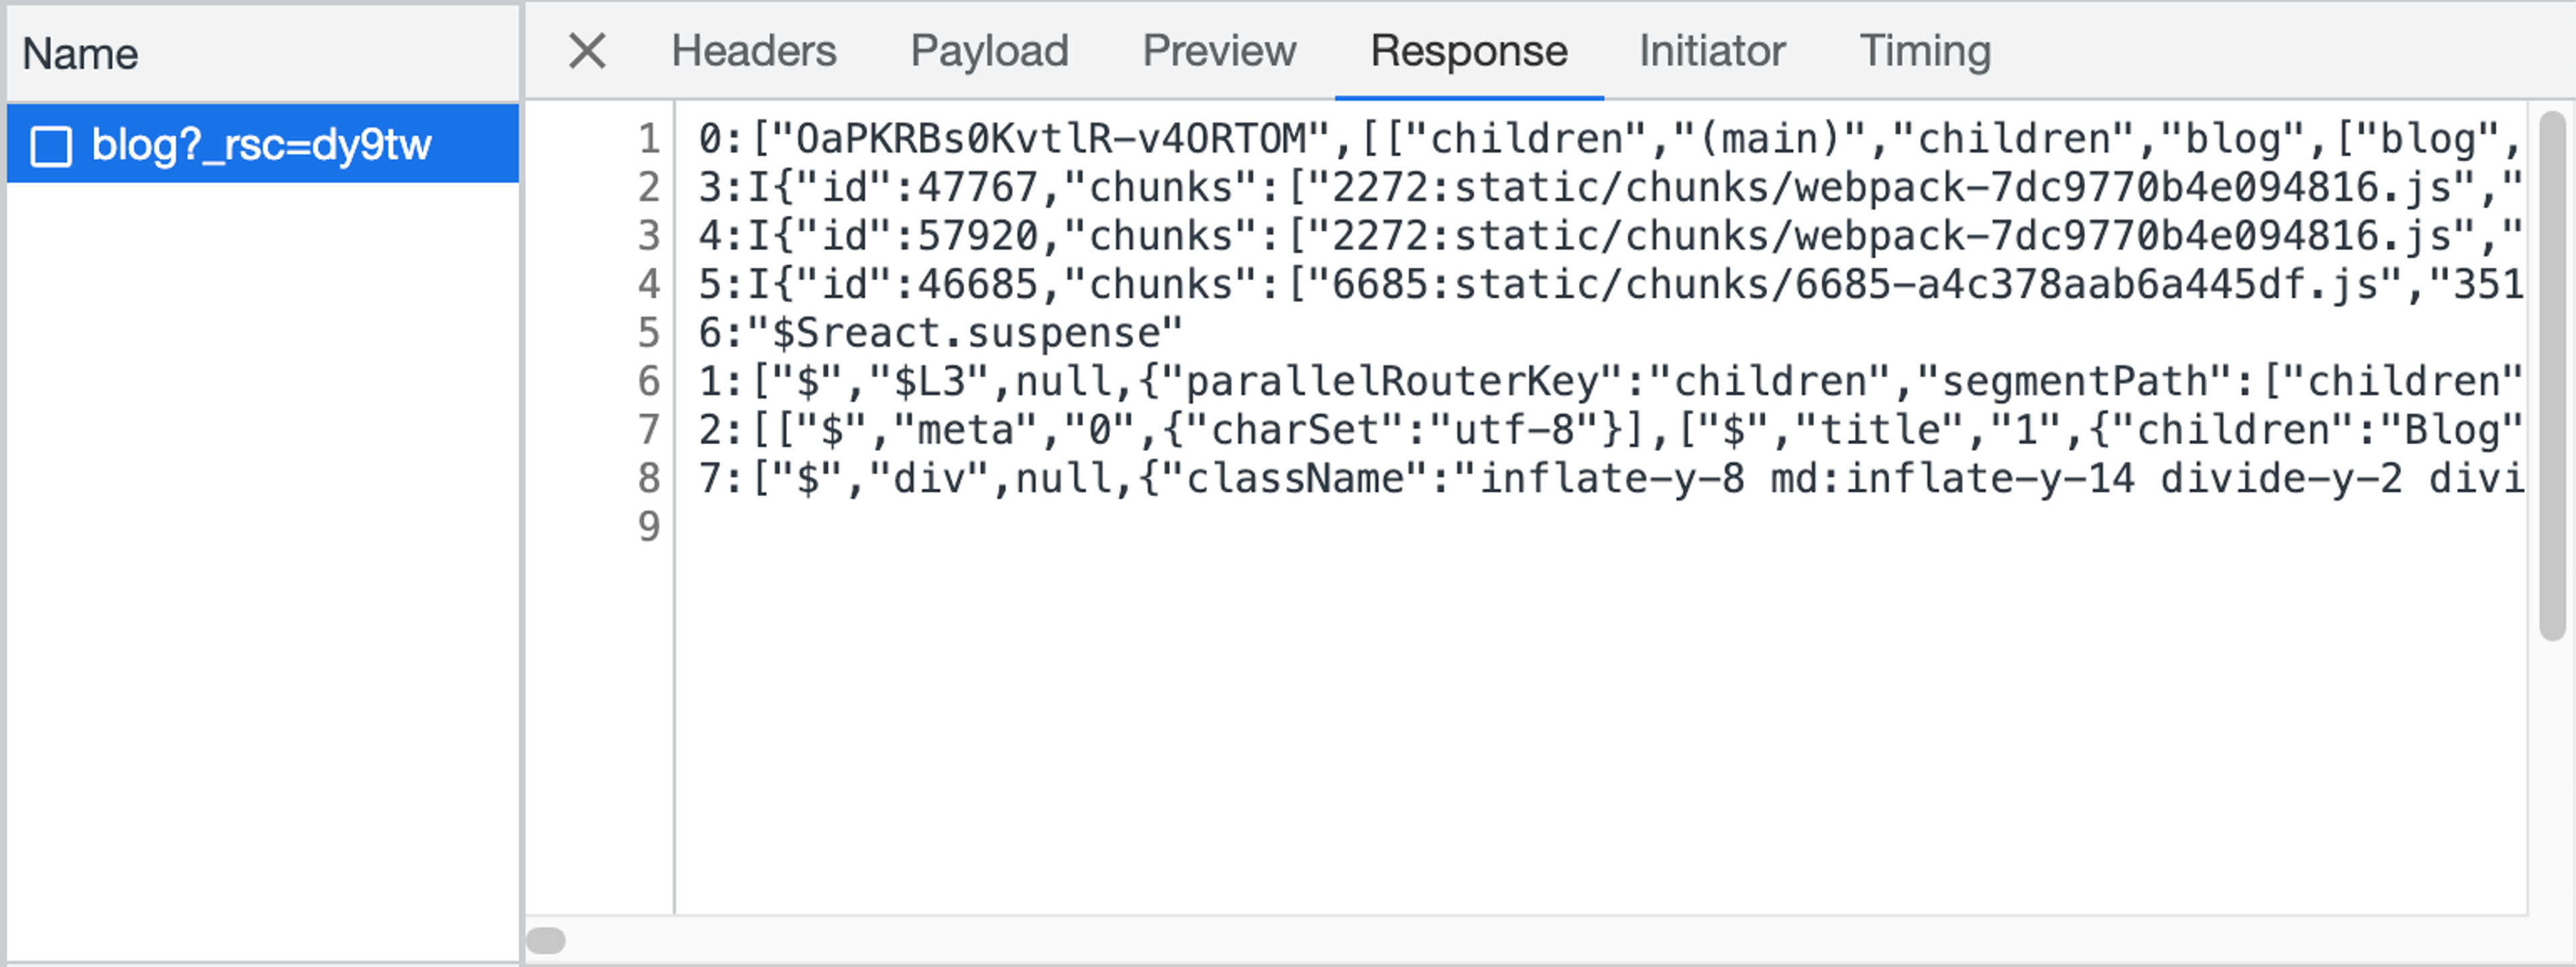
This is an example of the format, as seen from the /blog route on this site. This type of response will only be seen on subsequent navigations. If you were to load /blog as your initial load, you'd only get a html response.
You may notice that the scroll bars at the bottom of the screenshot. Some of the lines are really long. This is problematic if you're trying to make sense of the response. You may also notice that this response kind of looks like json. That's because it mostly is. Let's unpack what we're seeing.
Parsing the response
You'll notice that each line in the response starts with a number and a :. After that, we sometimes get a letter. In this case, all we can see is an I on some of the lines. The rest is JSON.
That means that we can easily turn a line like:
Into a JSON object like:
Suddenly a lot more readable. Initially when wanting to understand this, this is what I did. Copy, paste, edit the beginning slightly, format as JSON. But it got really tedious, really quick.
So I thought, why not, I write a little parser. We can start like this:
- Split the response by newlines
- Look for a number in the beginning, let's call that
identifier. - Then look for a
:, and after that, there should either be a special letter or the beginning of JSON content. If there's a letter, likeI, let's save that and call ittype. If there's no letter, let's just let thetypebenullfor now. - After that, there should be JSON data. Let's save that as
data.
Repeated over each line, an array looking somewhat like this.
I've cut out a lot of the data to keep the length reasonable, but it's enough to get an idea the structure.
Now we've got something much more readable. You can start to see there are different types of data.
- Looking at the
Itypes, it looks like they're referencing to some javascript files. These are files that need to be loaded to render content that is on the page. - Looking at the
nulltypes, some of them look a lot like React elements. There's html tags, classNames and children. These are indeed used for representing the tree of the page.
As you might imagine, there's a lot more nuance and details to this format. Please see the above as only a simplified example.
Visualising the data
When I had this parsed structure in place, I began thinking about ways to present it in a nicer way. Chrome DevTools had really long horizontal lines, but what I got myself instead a really long (vertical) formatted json file.
My first idea was to split each line into some tabs. Each tab gets the identifier , a remapped type as well as a size indicator that shows the % of the total response length for each line.

With different types for each line, we can render tab content differently for each of them.
For the client ref type, you see a list of files that need to be loaded.
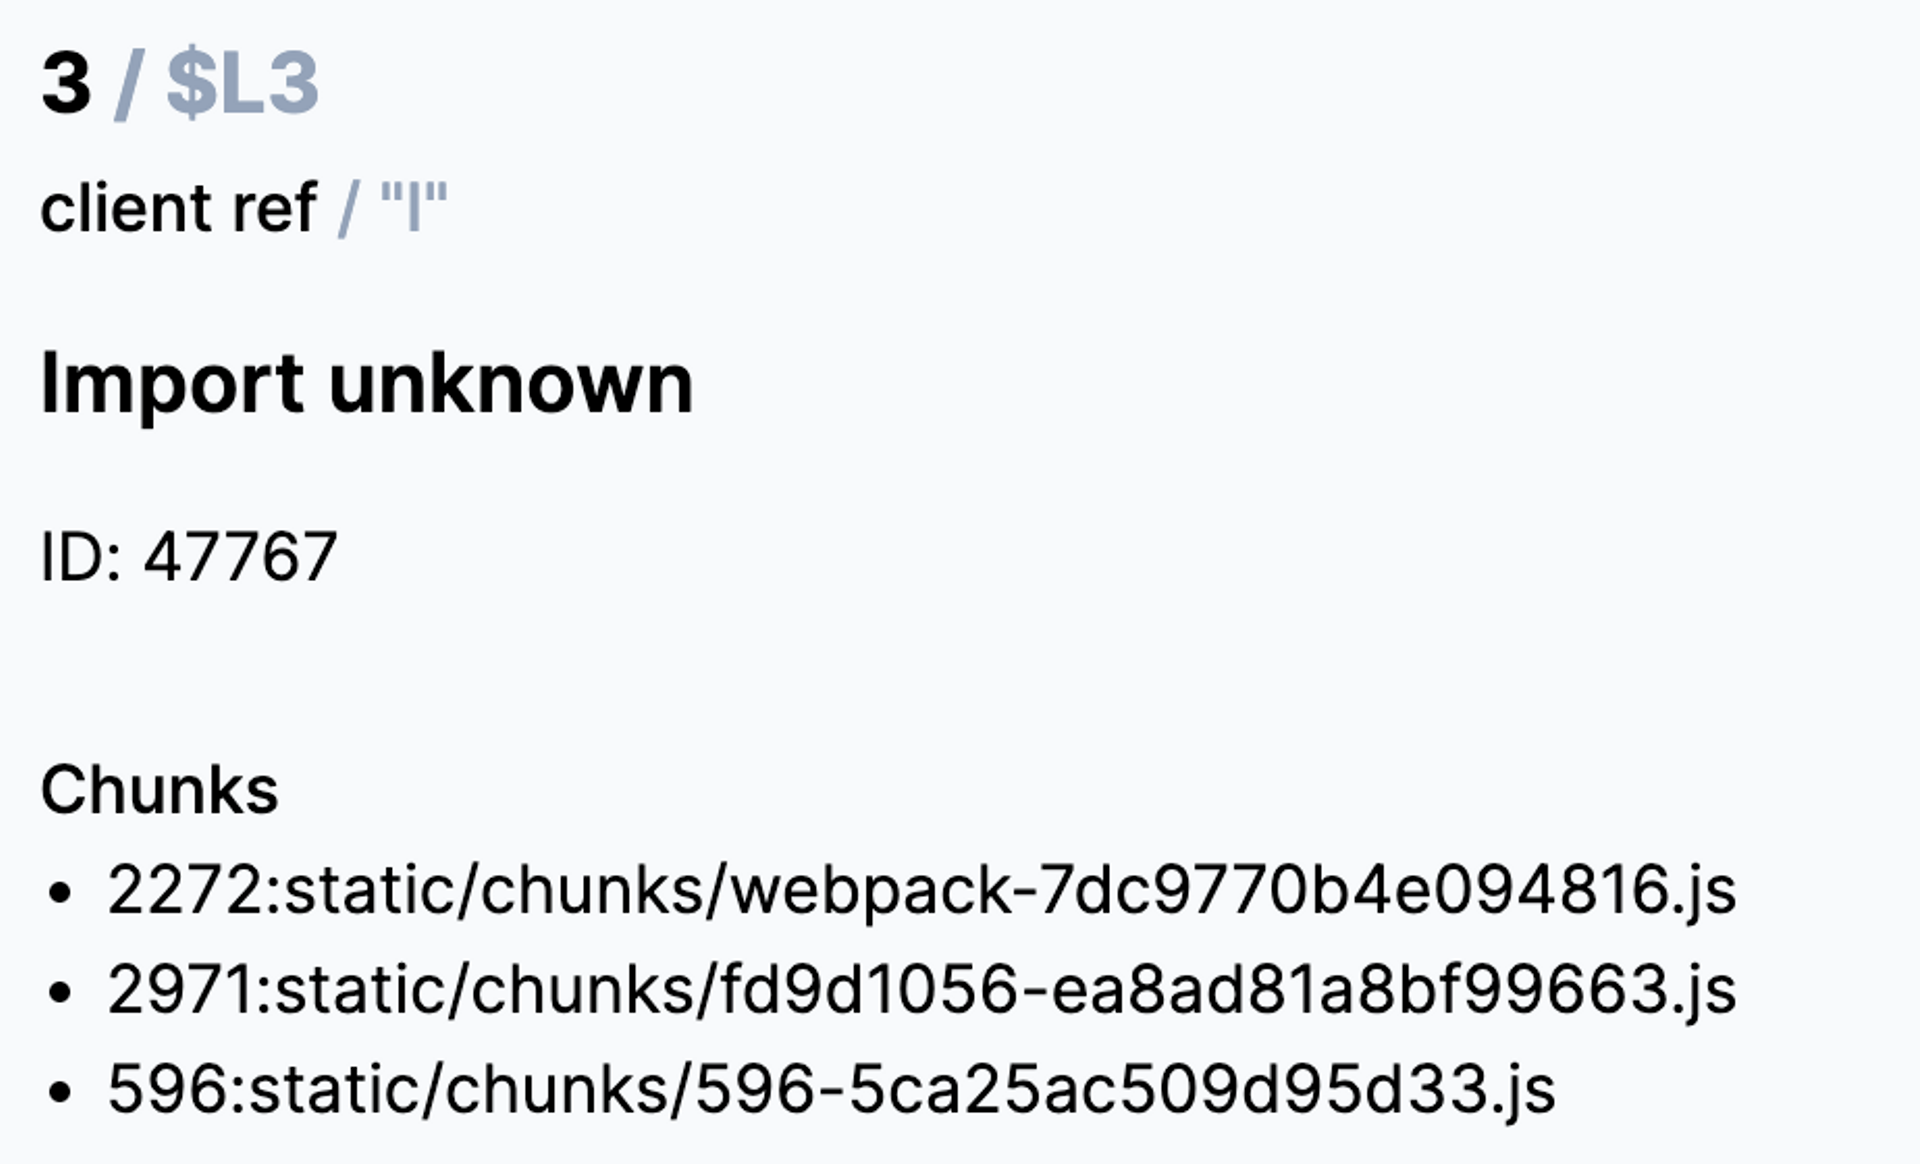
Sometimes you can see the name of a client component as well.
Then for the tree type, I render code that closely matches the JSX you write.
![7 / $L7 tree / "" <div className="inflate-y-8 md:inflate-y-14 divide-y-2 divide-separator divide-solid" > <section className="flex flex-col md:flex-row items-start" > <h3 className="font-heading text-3xl md:text-5xl md:min-w-[180px] mb-8 md:mb-0" > 2022 </h3> <ul className="space-y-8" > <li> <em className="block" > 29 December 2022 </em>](https://cdn.sanity.io/images/crizldqq/production/1314e1f95abf8e14c76a4ed0d2c9cb0e2e058c94-1750x1134.png?w=3840&q=75&fit=clip&auto=format)
Producing this tree was quite a fun challenge. The gist of it is a recursive component called Node. That walks the component tree and outputs styled React elements as it progresses.
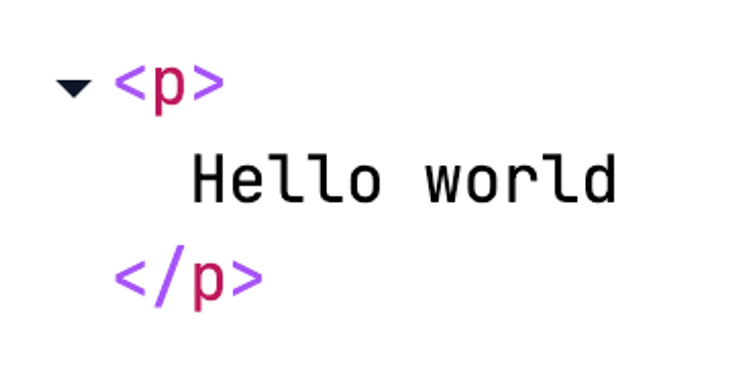
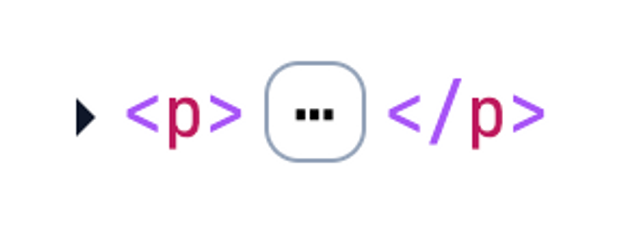
A basic tag is expressed like this by React:
I render this like this:
You can also collapse tags:
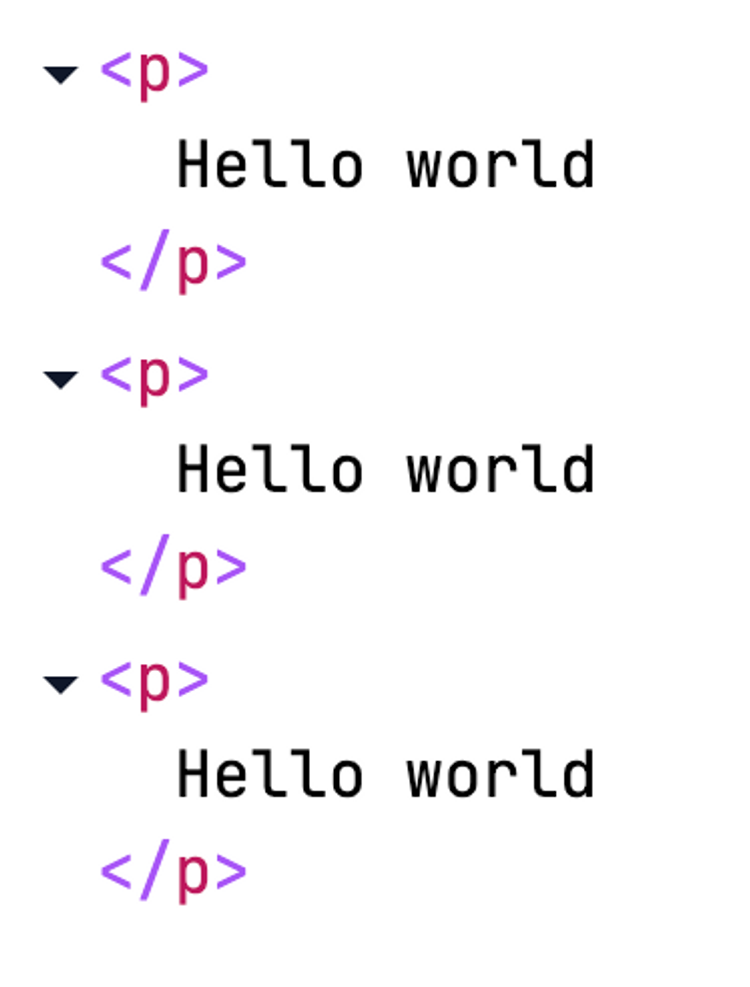
The Node component can also take an array of elements:
And the output looks like this:
I could probably write a whole article about just this component, but you can explore some examples I've set up in a Storybook →. The goal is valid JSX output that you can copy into your editor.
If you look around the trees, you may also find some strings like $L6. This is a reference to another line. It could for example be a client component or another tree.
The first tool
Now I had some building blocks, I made rsc-parser.vercel.app →.
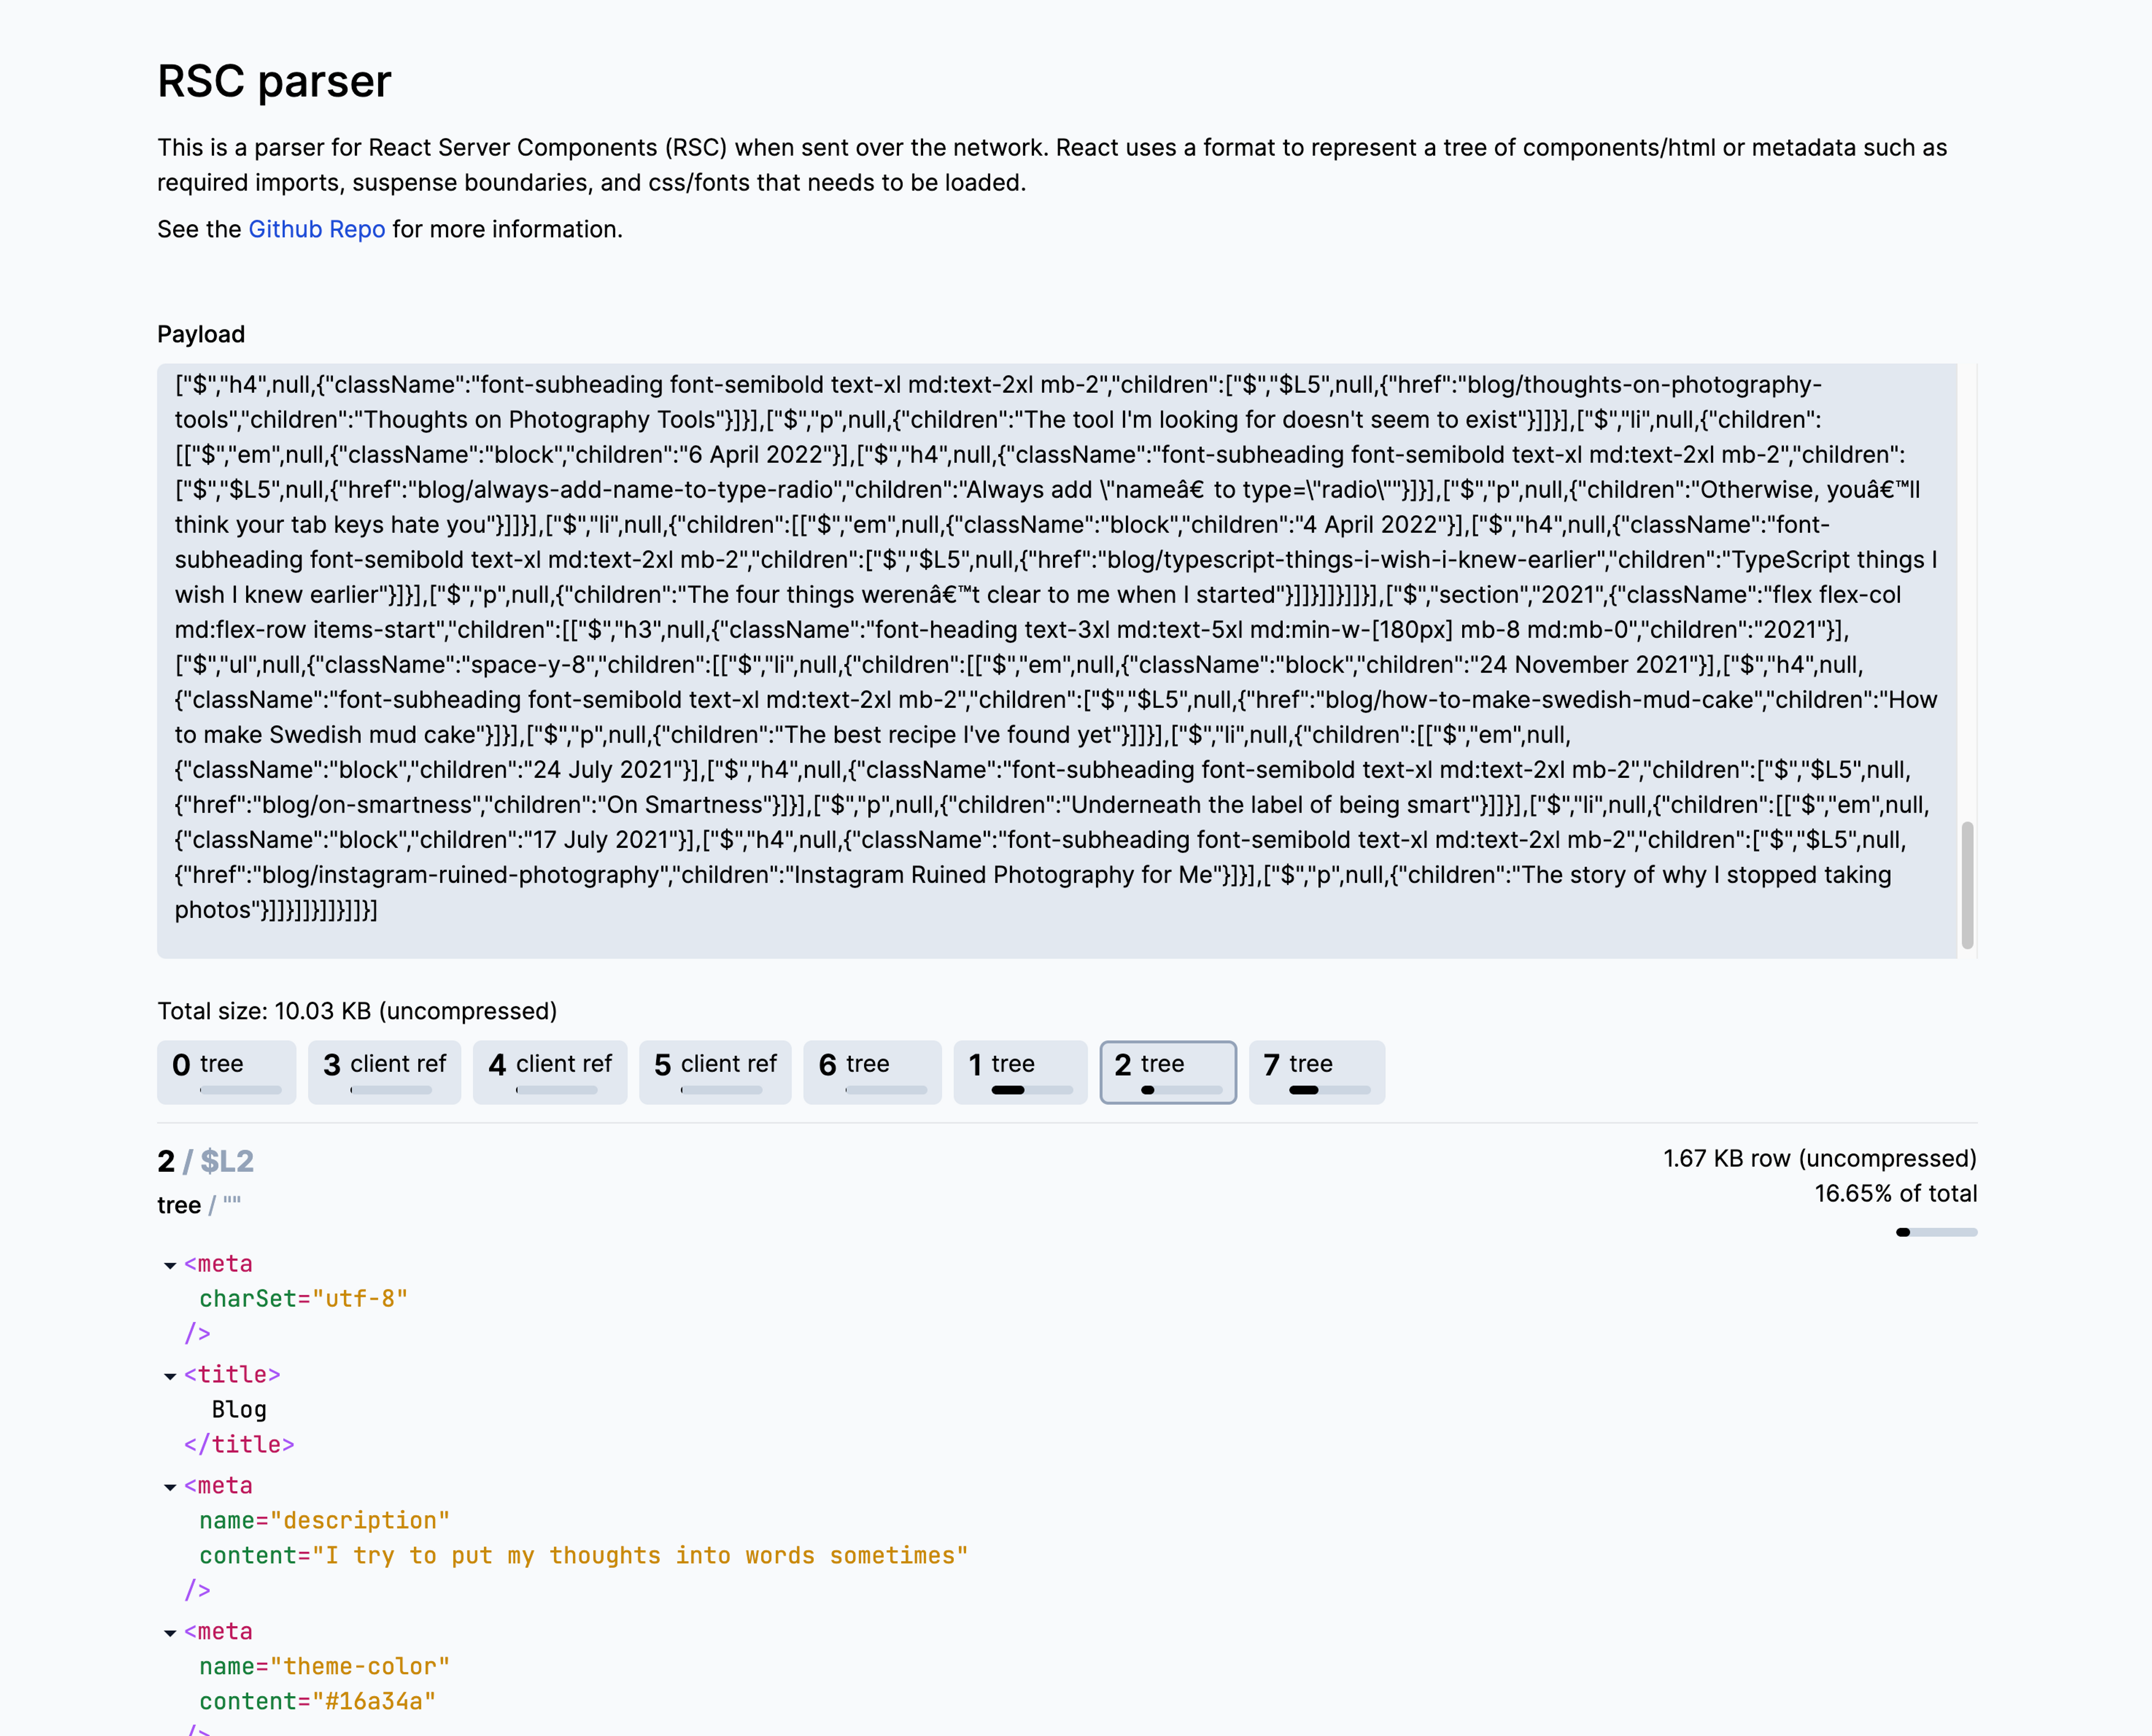
This is a page where you can copy paste network response sites using RSC, and get a nicer experience exploring the data. You can explore the trees and imports and get a feel for the order that things are streaming in.
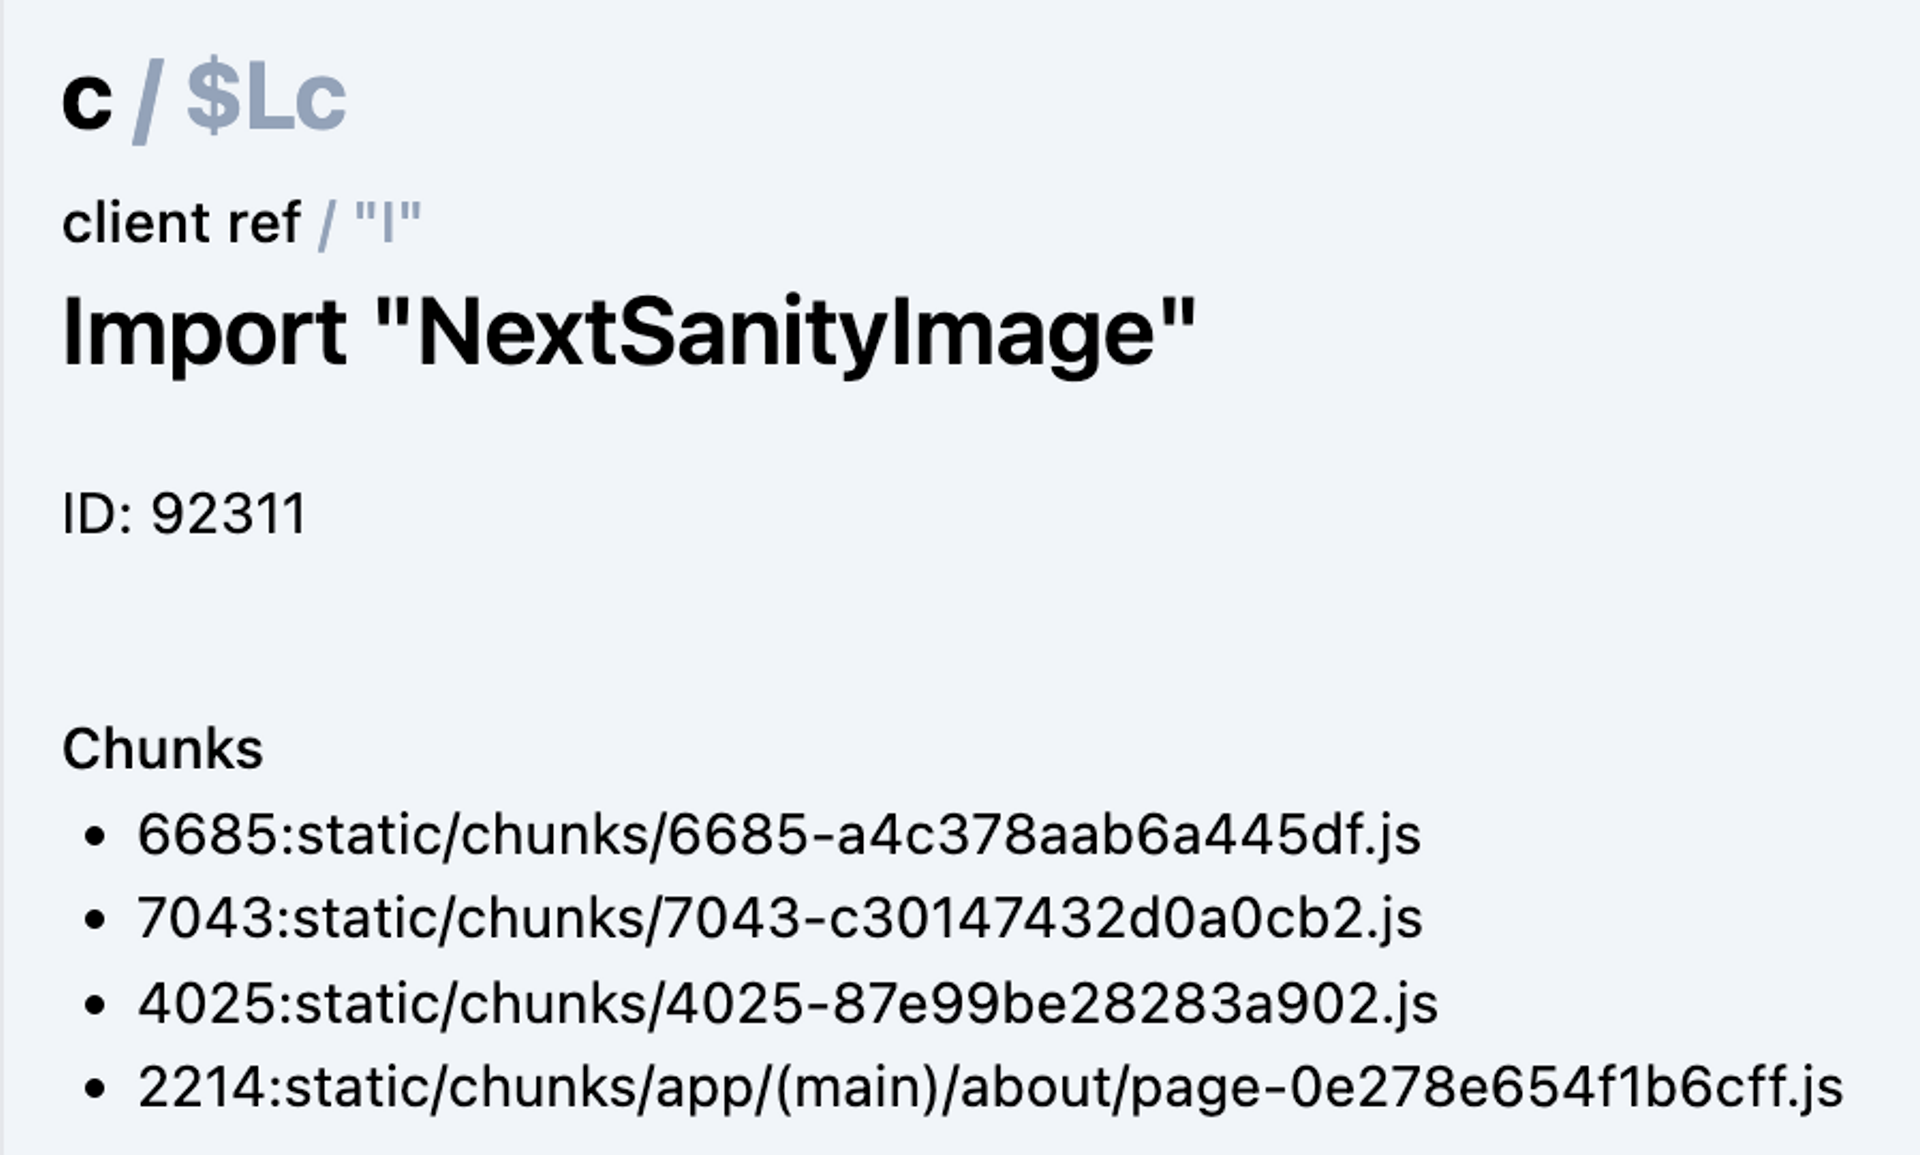
This was already useful, and let me find some curious things on my site. For example, I noticed the object of data that I send to my NextSanityImage client component was excessively large:
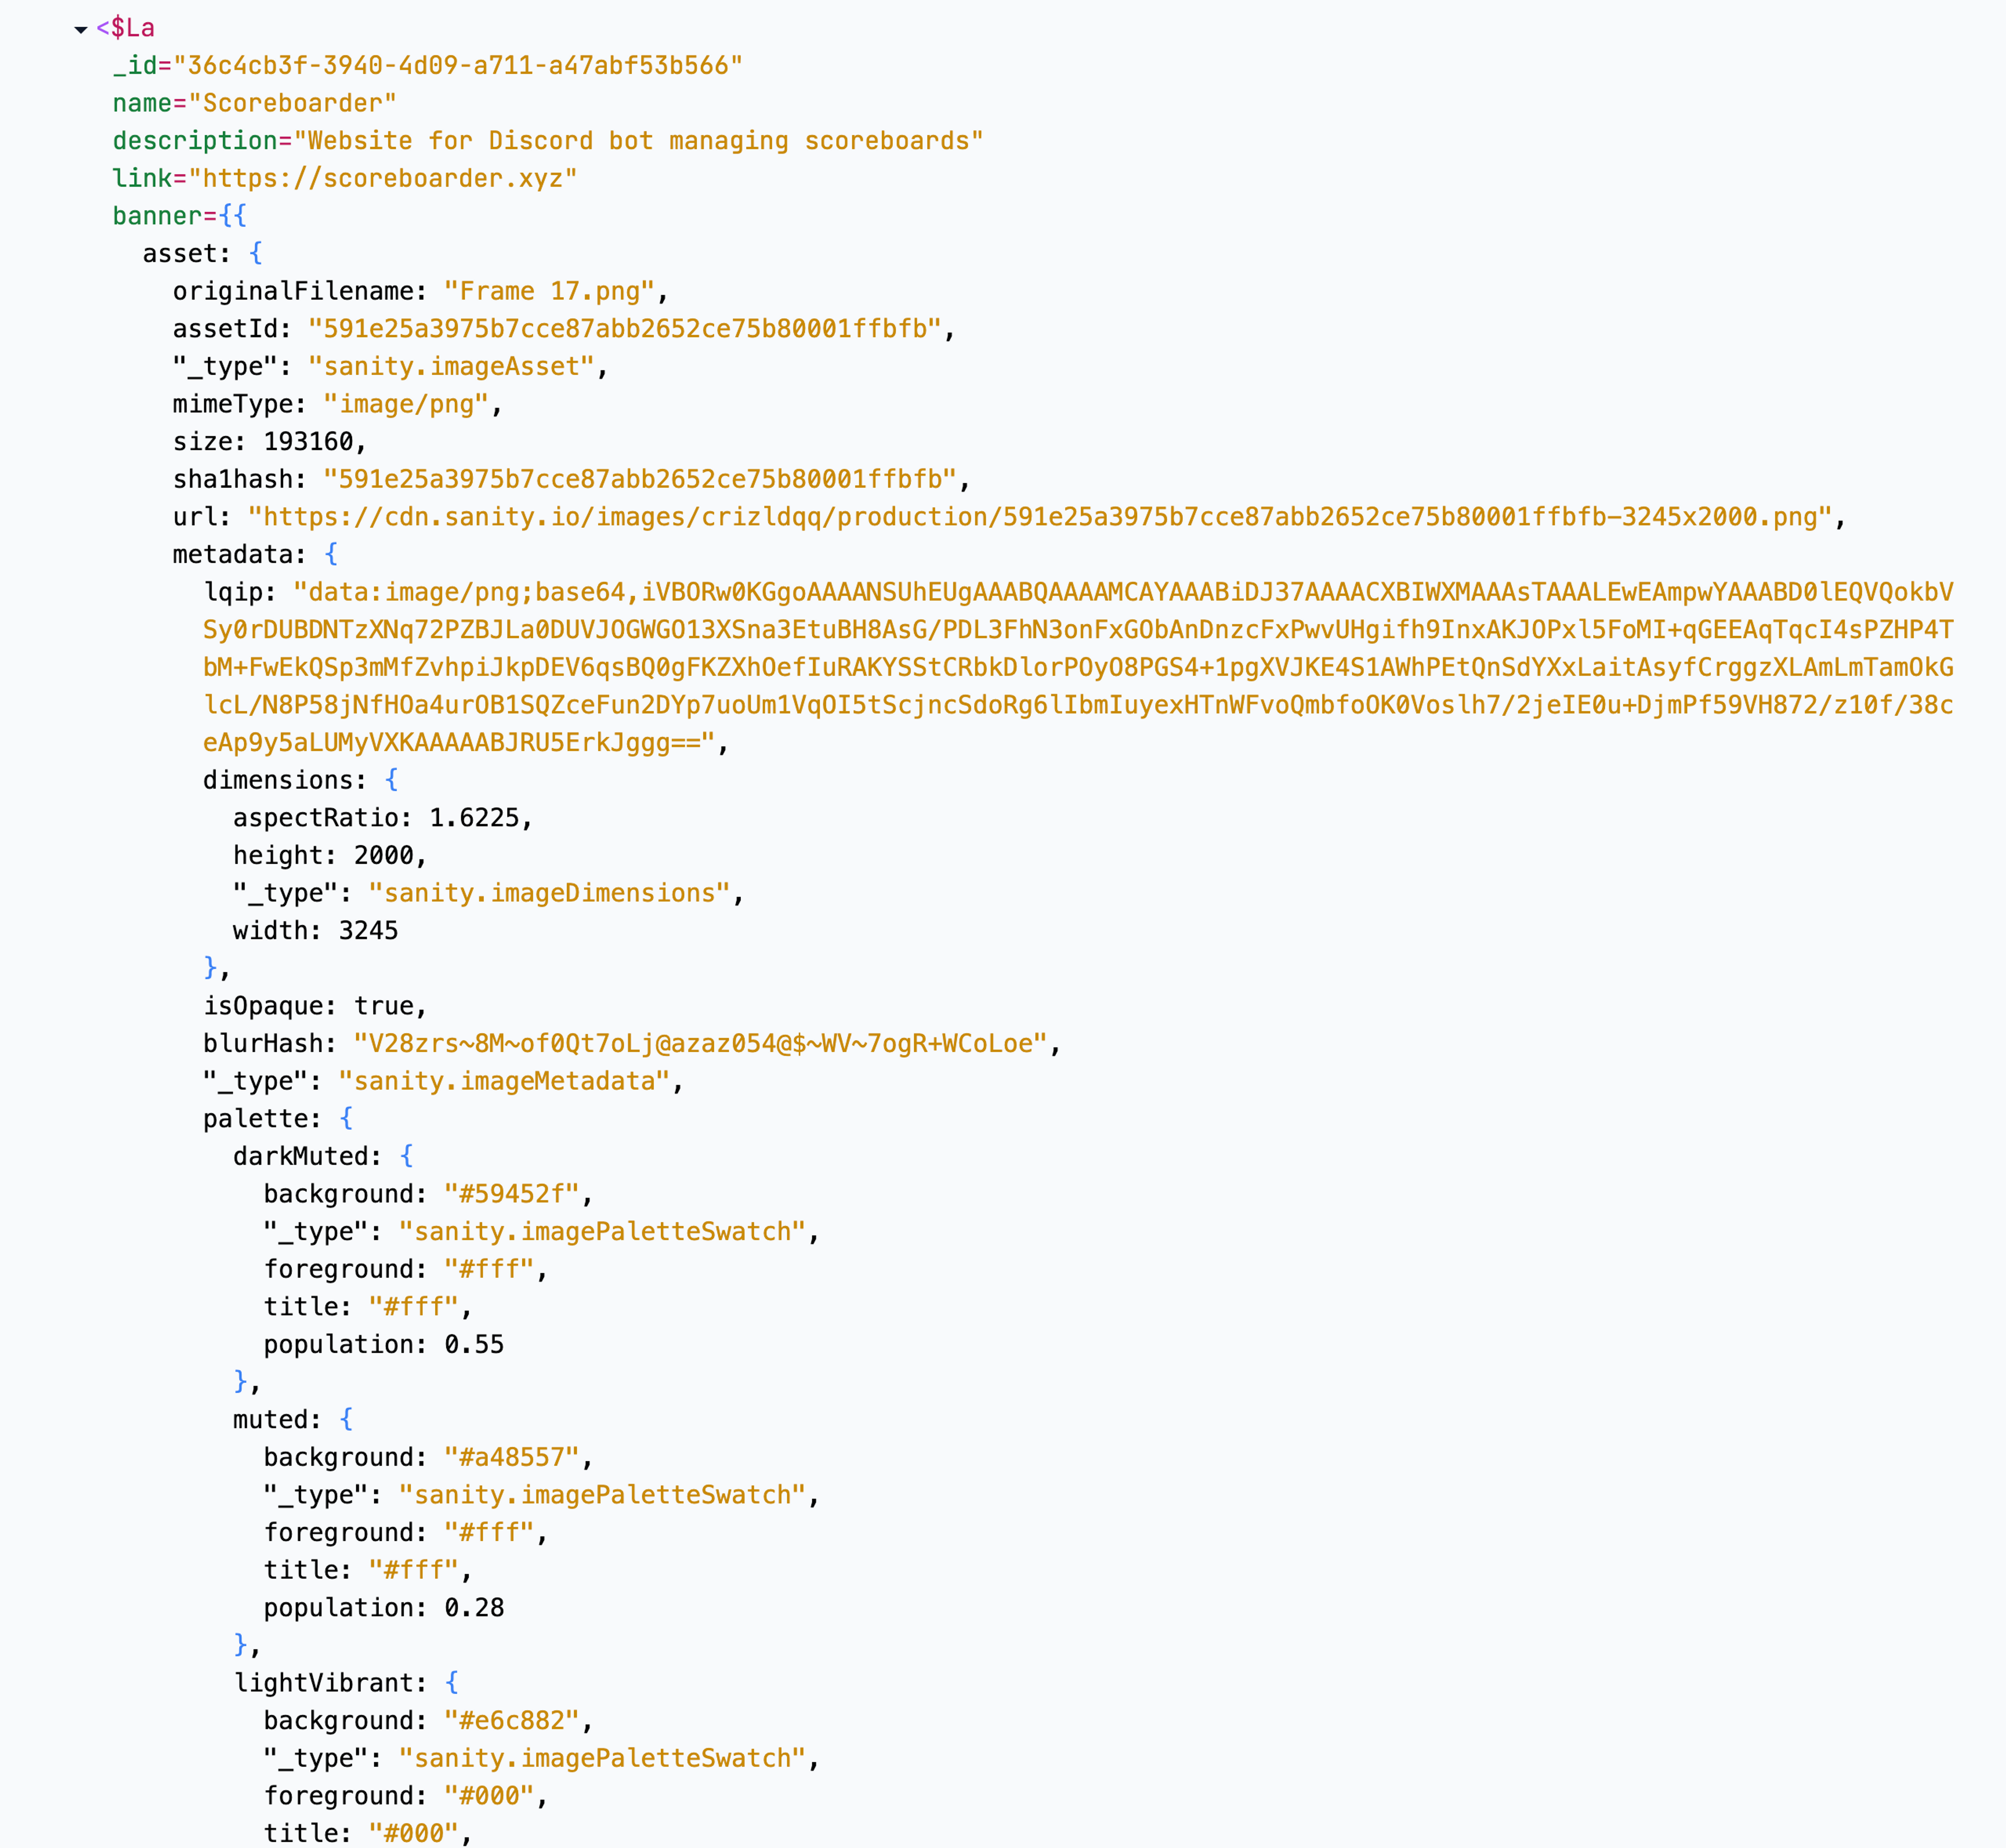
It turns out that Sanity has all this useful metadata about images. Great if you need it, unnecessary if you're not using it. A simple tweak to my query to only select the fields that I needed reduced the size of the page by 34%.
The image={} prop now looks like this:
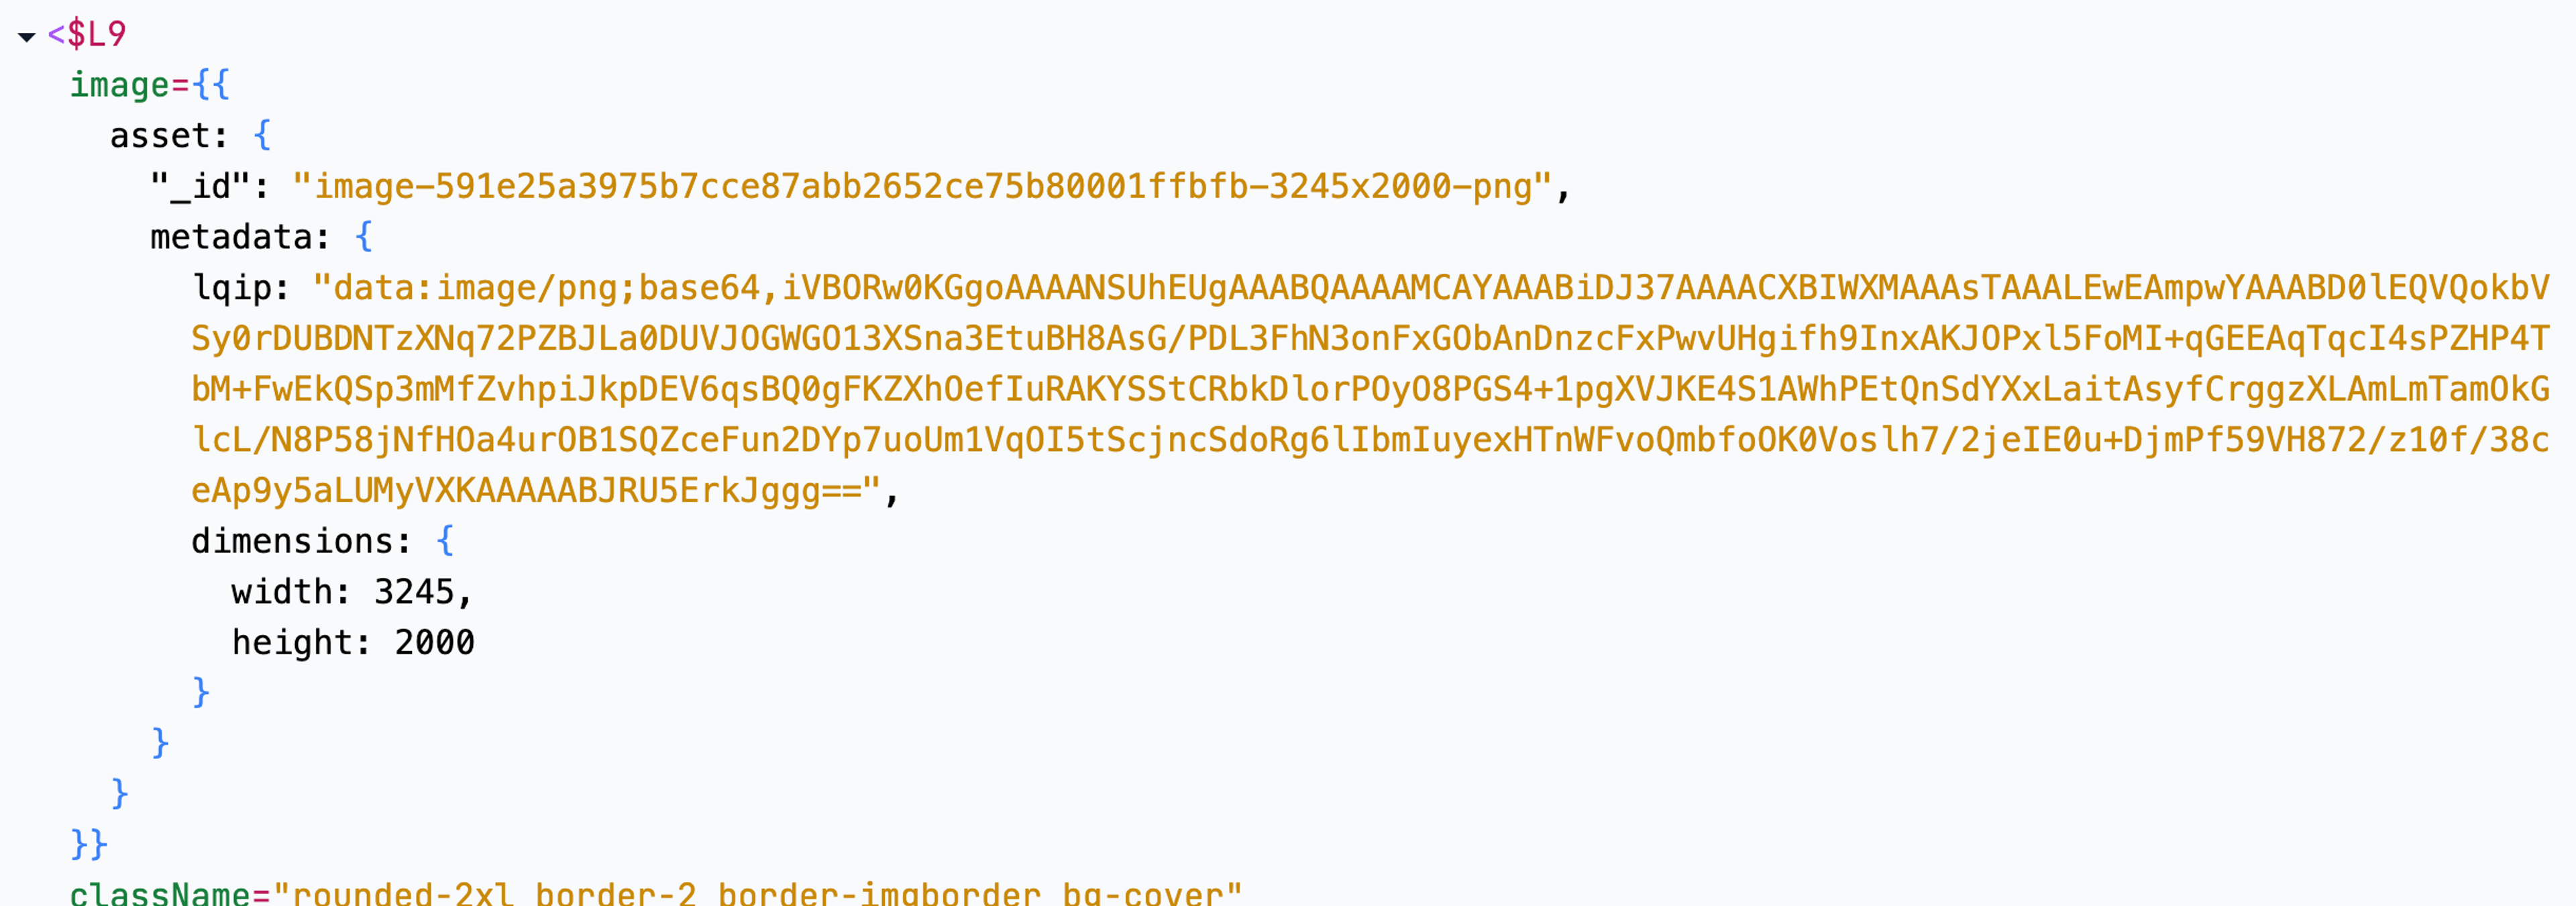
A similar but even more embarrassing mistake on the /blog route reduced the size by -86%. Issues like this can be caught in other ways, but this tool made it really obvious what what actually being sent over the wire.
Creating a browser extension
The website that you can copy-paste into is useful, but I realised quite quickly that it would be even better if you could just record the responses as they came in and as you browsed. That lead me to to create an extension that runs next to your side, and presents information as it comes in.
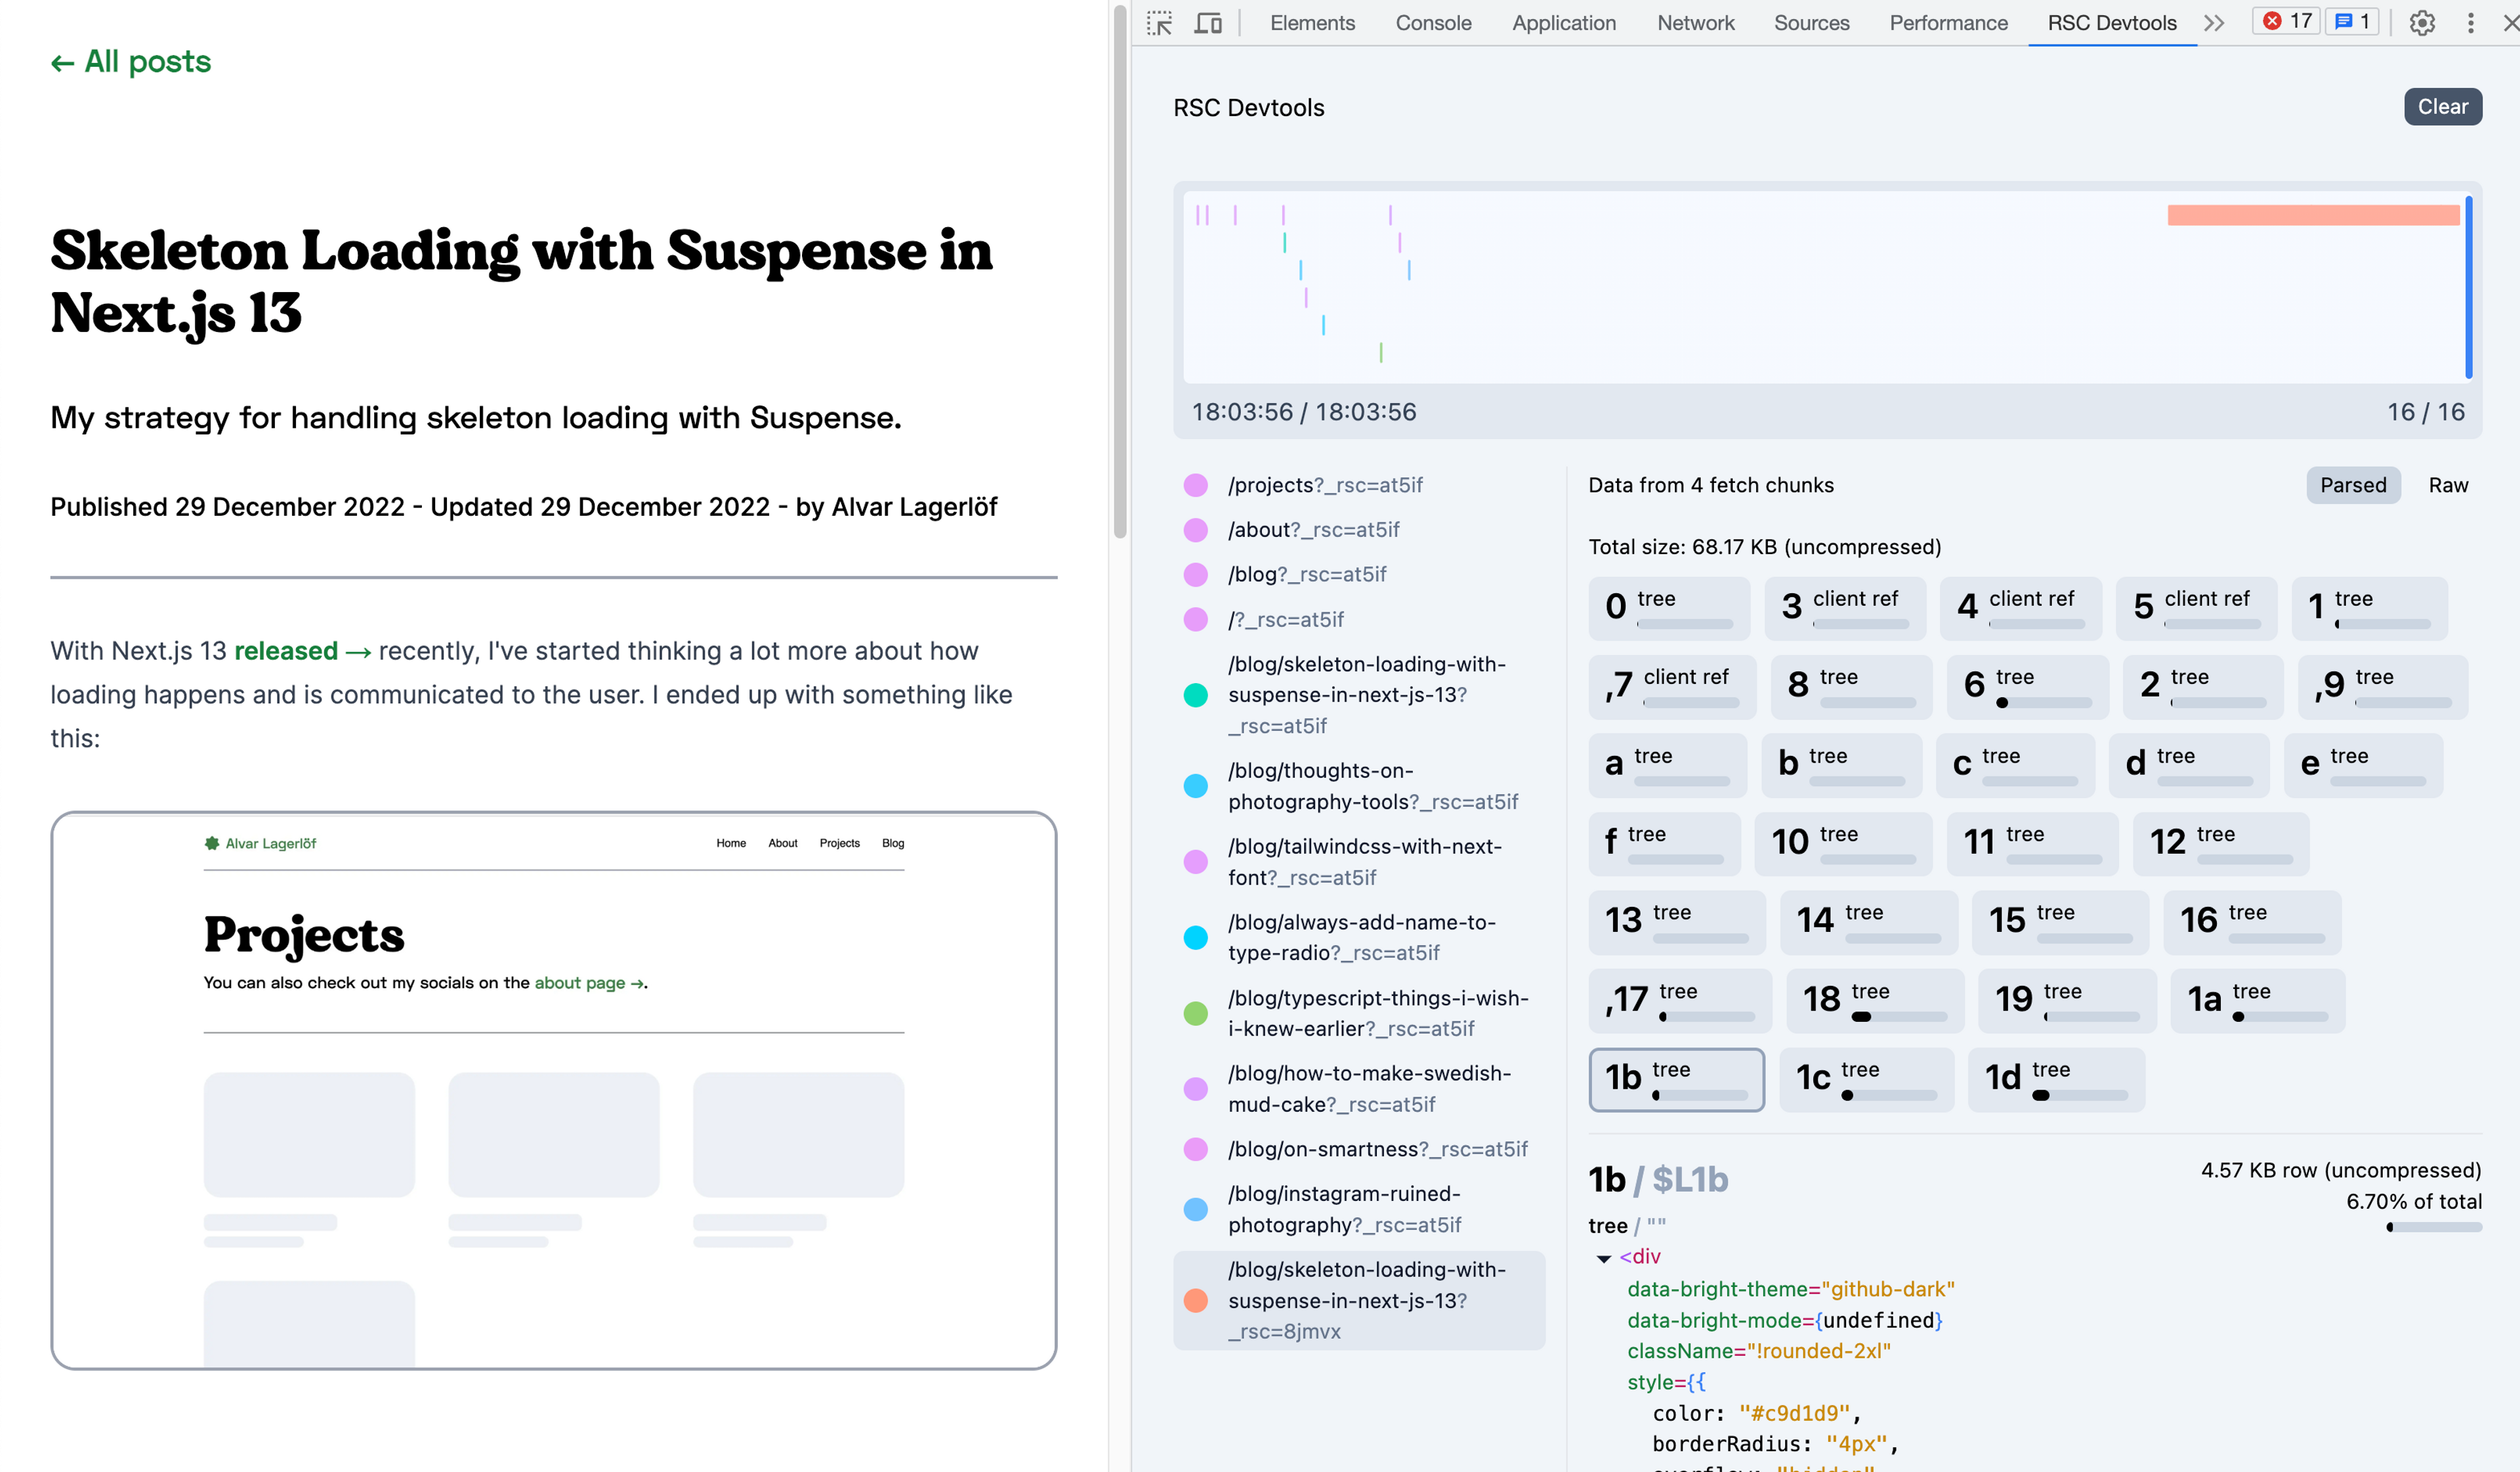
What you're seeing above is the extension running next to the production version of this website, with a scrubbable timeline at the top, various RSC responses in a vertical tab list, and their content of each response parsed and rendered.
Creating an extension not only makes it it a lot easier to quickly explore what's being sent, but it also allows you to time-travel the data. The extension stores timestamps for each streaming chunk, letting you granularly how the lines for a page are loaded. There are lots of opportunities for interesting visualisation here.
Next steps
This extension is currently still in very early stages, and a few key things need to be resolved:
fetch()is patched globally on all sites to clone bodies for RSC responses. This is useful for RSC fetches, but probably not great for everything else. Either another way needs to be found or it should only happen temporarily (like when pressing a record button).- The DevTools panel s not aware of the tabs, so all of them will send data to it.
- Firefox support is missing.
- Distribution to extension stores.
Furthermore, my reverse-engineering of the RSC wire format is not sustainable longer-term and likely to break soon. So I'm looking at ways to make use of some of the internal React code for parsing responses.
Usage
But if you're feeling adventurous, you can still try it by downloading build artefacts from GitHub → and loading them into a chromium-based browser. To minimize risk of breakage on other sites, you could load it into a different browser profile.
If you still want to try the parsing and visualisation, then copy-pasting into rsc-parser.vercel.app → is a risk-free alternative. They're using the same code, but the website lacks all time-based functionality.
If you're interested in reading more about RSC I recommend the following:
- Demystifying RSC → by Matt Kruse →
- Understanding React Server Components → on the Vercel blog